Global Cocoa Weather Intelligence Dashboard
Professional multi-country cocoa belt coverage with hover detail, year-on-year comparison, country filters, and dense point network. Generated 2026-06-22 10:26 UTC
Market Bias: Bearish weather bias for cocoa
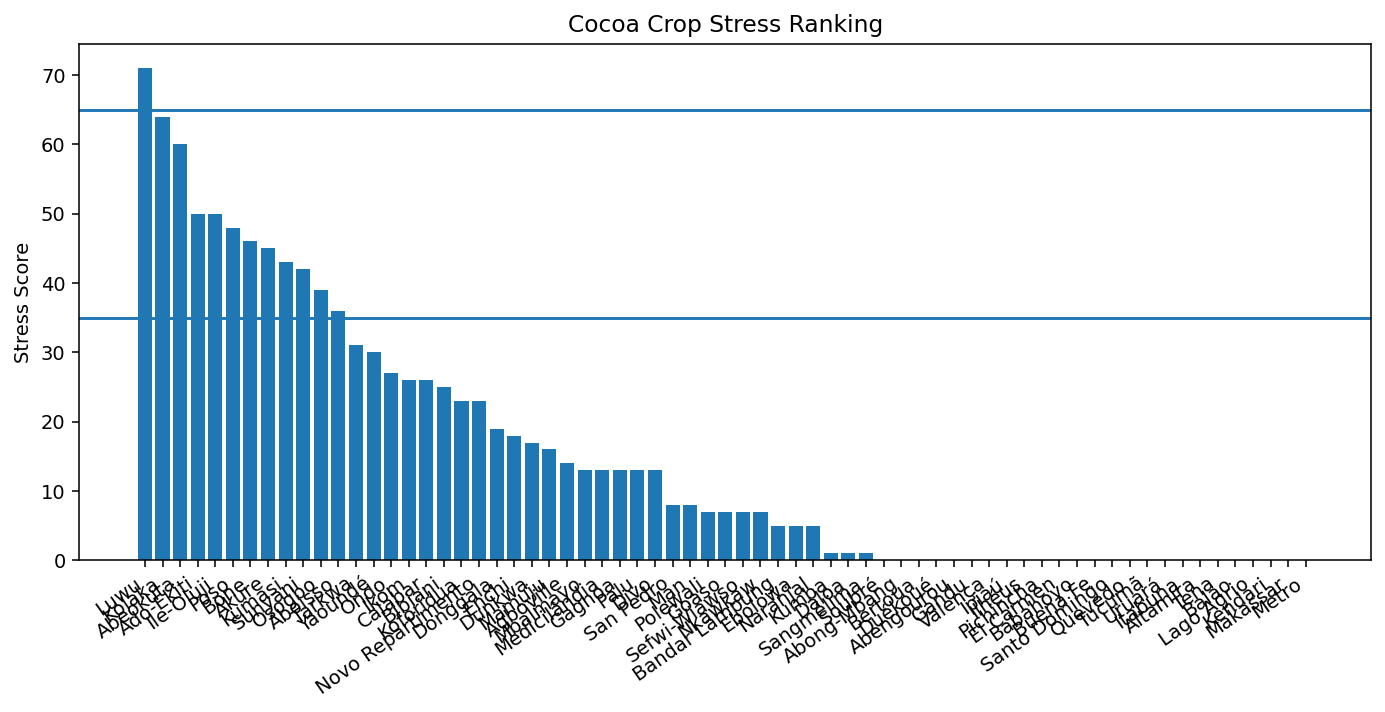
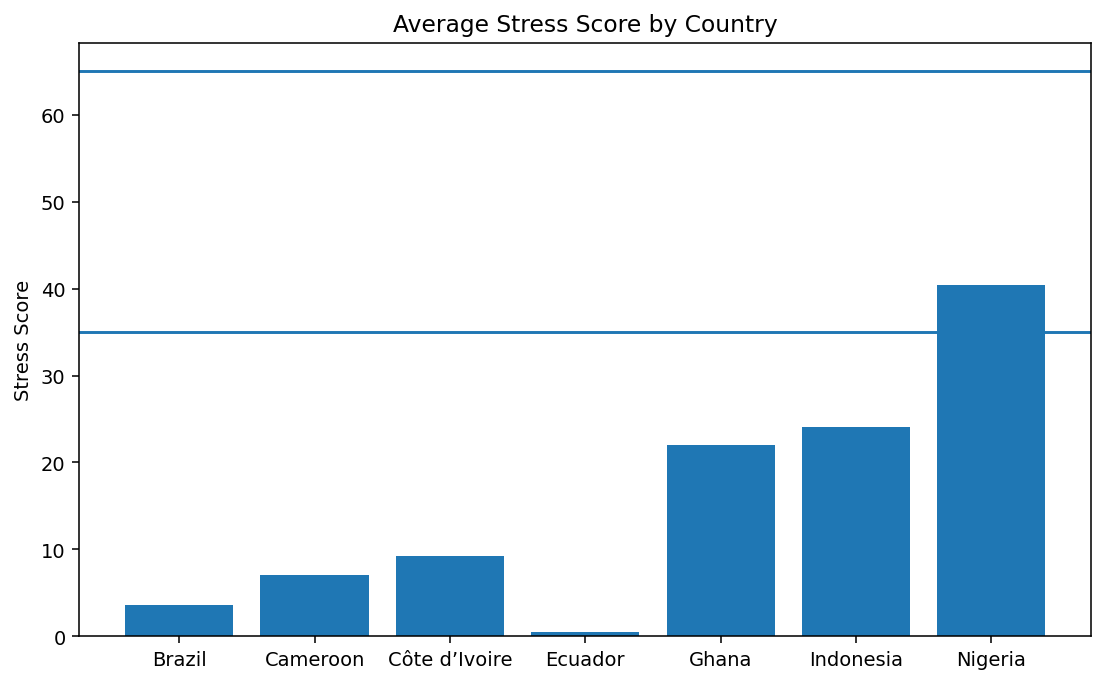
Average Stress Score
9.7
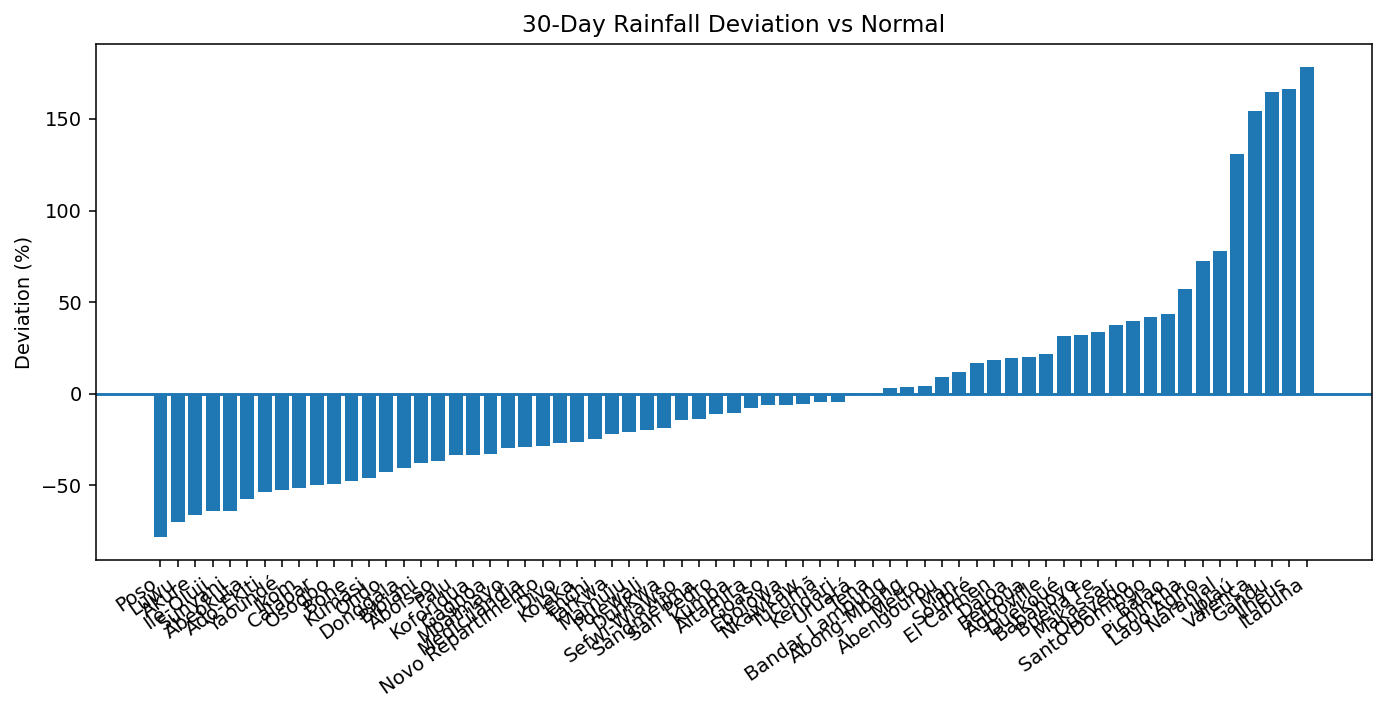
Average 30d Rain Deviation
23.9%
Average Temp Anomaly
0.1°C
Tracked Cocoa-Belt Points
67
Cocoa Weather Map
Supportive / low stress
Transitional
High stress / weather risk
Hover or click any marker. Use country and layer filters to inspect individual cocoa belts without clutter.
Move over a region
Stress score
—
Weather signal
—
Rainfall 7d
—
Rainfall 30d
—
Temp anomaly
—
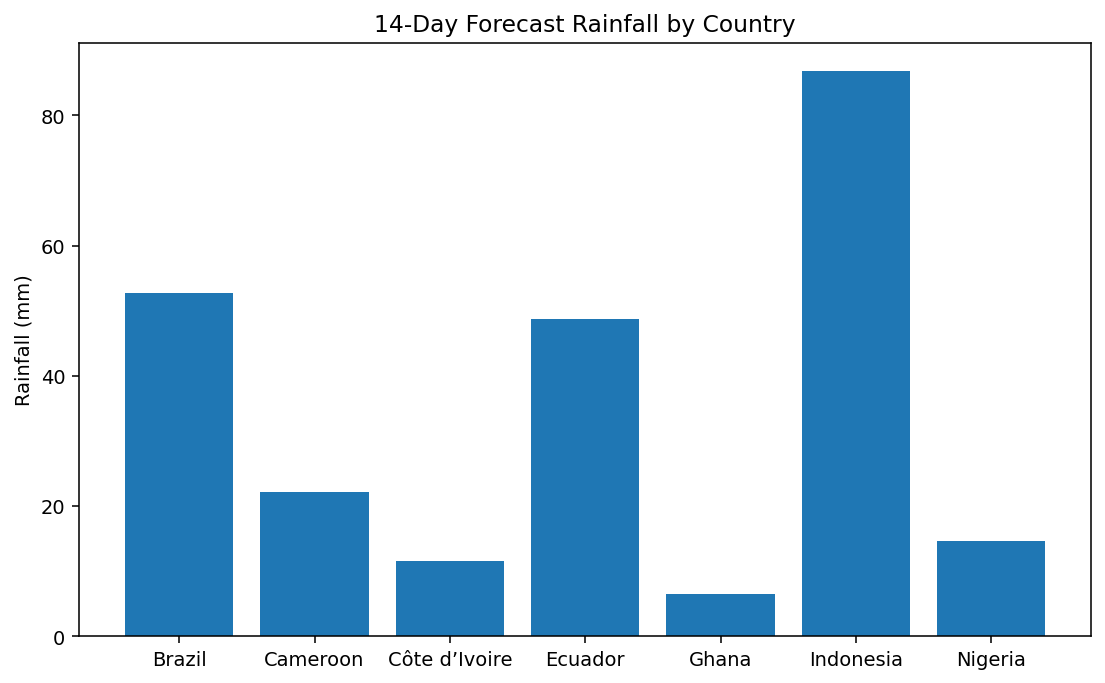
Forecast next 14d
—
Comparison Panel
| Metric | Now | Prev year same week | Deviation |
|---|
Active Weather Alerts
Rainfall Deficit
Tena is running -41.0% below 30-day normal rainfall.
Tena is running -41.0% below 30-day normal rainfall.
Rainfall Deficit
Kolaka is running -41.2% below 30-day normal rainfall.
Kolaka is running -41.2% below 30-day normal rainfall.
Rainfall Deficit
Kendari is running -39.9% below 30-day normal rainfall.
Kendari is running -39.9% below 30-day normal rainfall.
Rainfall Deficit
Makassar is running -38.5% below 30-day normal rainfall.
Makassar is running -38.5% below 30-day normal rainfall.
Rainfall Deficit
Bandar Lampung is running -47.9% below 30-day normal rainfall.
Bandar Lampung is running -47.9% below 30-day normal rainfall.
Rainfall Deficit
Metro is running -43.1% below 30-day normal rainfall.
Metro is running -43.1% below 30-day normal rainfall.
Regional Snapshot
| Country | Region | Rain 7d | Rain 30d | 30d Dev vs 5y | 30d Dev vs 1y | 30d Dev vs 3y | 30d Dev vs 5y | 30d Dev vs 10y | YoY 7d | YoY 30d | Temp Anomaly | Humidity 7d | Soil Moisture | Dry Days | Forecast 14d | Harmattan | Stress |
|---|---|---|---|---|---|---|---|---|---|---|---|---|---|---|---|---|---|
| Brazil | Ipiaú | 4.7 | 61.1 | -21.6% | -22.6% | -29.1% | -21.6% | -28.6% | -77.1% | -22.6% | 1.2°C | 78.4% | nan | 3 | nan | Out of season | 32.0 — Healthy |
| Brazil | Itabuna | 9.7 | 47.9 | -11.2% | -38.8% | -24.6% | -11.2% | -22.4% | -33.2% | -38.8% | 0.4°C | 83.1% | nan | 3 | nan | Out of season | 8.0 — Healthy |
| Brazil | Gandu | 10.5 | 75.8 | 1.4% | 4.1% | -10.7% | 1.4% | -7.0% | -37.1% | 4.1% | 1.0°C | 83.7% | nan | 2 | nan | Out of season | 4.0 — Healthy |
| Brazil | Valença | 10.5 | 75.8 | 1.4% | 4.1% | -10.7% | 1.4% | -7.0% | -37.1% | 4.1% | 1.0°C | 83.7% | nan | 2 | nan | Out of season | 4.0 — Healthy |
| Brazil | Ilhéus | 15.4 | 87.8 | 47.4% | 31.9% | 23.1% | 47.4% | 37.5% | 47.1% | 31.9% | 0.5°C | 76.8% | nan | 2 | nan | Out of season | 0.0 — Healthy |
| Brazil | Medicilândia | 23.6 | 164.5 | 76.4% | 74.3% | 60.1% | 76.4% | 94.6% | 705.8% | 74.3% | 0.4°C | 91.0% | nan | 2 | nan | Out of season | 0.0 — Healthy |
| Brazil | Altamira | 20.4 | 173.4 | 60.3% | 67.1% | 69.6% | 60.3% | 70.8% | 258.4% | 67.1% | 0.2°C | 90.5% | nan | 2 | nan | Out of season | 0.0 — Healthy |
| Brazil | Uruará | 27.3 | 162.8 | 69.3% | 20.9% | 59.1% | 69.3% | 81.1% | 46.0% | 20.9% | 0.2°C | 91.1% | nan | 2 | nan | Out of season | 0.0 — Healthy |
| Brazil | Tucumã | 10.8 | 44.7 | 28.4% | -34.6% | 33.8% | 28.4% | 25.9% | -8.5% | -34.6% | -0.3°C | 83.7% | nan | 2 | nan | Out of season | 0.0 — Healthy |
| Brazil | Novo Repartimento | 22.0 | 91.1 | 22.5% | -1.2% | 42.8% | 22.5% | 23.0% | 1848.7% | -1.2% | 0.1°C | 86.4% | nan | 2 | nan | Out of season | 0.0 — Healthy |
| Cameroon | Kumba | 48.8 | 266.2 | -24.3% | 28.6% | -34.6% | -24.3% | -24.8% | 32.5% | 28.6% | -0.1°C | 92.5% | nan | 2 | nan | Out of season | 26.0 — Healthy |
| Cameroon | Yaoundé | 54.8 | 261.6 | 116.3% | 155.3% | 164.6% | 116.3% | 131.8% | 213.2% | 155.3% | -0.2°C | 90.2% | nan | 2 | nan | Out of season | 0.0 — Healthy |
| Cameroon | Mbalmayo | 59.9 | 303.9 | 140.6% | 180.6% | 180.3% | 140.6% | 152.9% | 277.7% | 180.6% | -0.2°C | 91.0% | nan | 2 | nan | Out of season | 0.0 — Healthy |
| Cameroon | Ebolowa | 82.9 | 261.9 | 102.9% | 155.4% | 132.6% | 102.9% | 110.9% | 422.6% | 155.4% | -0.6°C | 91.5% | nan | 2 | nan | Out of season | 0.0 — Healthy |
| Cameroon | Sangmélima | 64.8 | 257.2 | 102.9% | 137.8% | 115.7% | 102.9% | 97.5% | 312.3% | 137.8% | -0.9°C | 90.5% | nan | 2 | nan | Out of season | 0.0 — Healthy |
| Cameroon | Bertoua | 25.6 | 168.6 | 7.1% | 50.6% | 4.5% | 7.1% | 5.8% | 46.2% | 50.6% | -1.0°C | 84.2% | nan | 2 | nan | Out of season | 0.0 — Healthy |
| Cameroon | Abong-Mbang | 28.4 | 194.0 | 27.0% | 57.9% | 30.1% | 27.0% | 16.9% | 44.0% | 57.9% | -0.7°C | 87.7% | nan | 2 | nan | Out of season | 0.0 — Healthy |
| Côte d’Ivoire | Man | 23.8 | 165.1 | -29.8% | -9.5% | -27.3% | -29.8% | -33.5% | -10.5% | -9.5% | 0.6°C | 87.7% | nan | 2 | nan | Out of season | 26.0 — Healthy |
| Côte d’Ivoire | Daloa | 32.5 | 219.6 | -6.5% | 7.0% | -8.7% | -6.5% | -9.7% | 10.1% | 7.0% | 0.3°C | 86.9% | nan | 2 | nan | Out of season | 8.0 — Healthy |
| Côte d’Ivoire | Soubré | 50.6 | 332.5 | 26.5% | 17.3% | 18.1% | 26.5% | 14.3% | 18.5% | 17.3% | -0.2°C | 90.7% | nan | 2 | nan | Out of season | 0.0 — Healthy |
| Côte d’Ivoire | San Pedro | 85.8 | 397.6 | -3.0% | -1.9% | -22.4% | -3.0% | -18.5% | 69.5% | -1.9% | -0.3°C | 87.3% | nan | 2 | nan | Out of season | 0.0 — Healthy |
| Côte d’Ivoire | Abengourou | 55.8 | 239.8 | 3.7% | -5.8% | -5.6% | 3.7% | 5.3% | 17.7% | -5.8% | 0.4°C | 89.7% | nan | 2 | nan | Out of season | 0.0 — Healthy |
| Côte d’Ivoire | Divo | 55.4 | 203.1 | -9.7% | 16.9% | -12.1% | -9.7% | -15.5% | 41.7% | 16.9% | 0.0°C | 90.9% | nan | 2 | nan | Out of season | 0.0 — Healthy |
| Côte d’Ivoire | Agboville | 75.3 | 261.7 | 11.9% | 10.3% | 4.4% | 11.9% | 15.2% | 36.3% | 10.3% | 0.1°C | 90.9% | nan | 2 | nan | Out of season | 0.0 — Healthy |
| Côte d’Ivoire | Aboisso | 74.7 | 300.2 | 0.3% | -10.2% | -13.4% | 0.3% | 3.0% | 9.7% | -10.2% | -0.0°C | 89.5% | nan | 2 | nan | Out of season | 0.0 — Healthy |
| Côte d’Ivoire | Gagnoa | 46.9 | 246.3 | -2.0% | 1.9% | -5.7% | -2.0% | -10.8% | 10.0% | 1.9% | -0.1°C | 91.3% | nan | 2 | nan | Out of season | 0.0 — Healthy |
| Côte d’Ivoire | Duékoué | 40.0 | 270.1 | 33.0% | 52.1% | 24.3% | 33.0% | 20.3% | 73.5% | 52.1% | -0.1°C | 89.3% | nan | 2 | nan | Out of season | 0.0 — Healthy |
| Ecuador | Tena | 21.9 | 169.1 | -41.0% | -56.4% | -41.2% | -41.0% | -40.9% | -81.0% | -56.4% | -0.1°C | 89.2% | nan | 2 | nan | Out of season | 36.0 — Mild stress |
| Ecuador | Quevedo | 73.8 | 331.7 | 160.9% | 72.9% | 139.8% | 160.9% | 264.1% | 1.5% | 72.9% | -0.4°C | 89.8% | nan | 2 | nan | Out of season | 0.0 — Healthy |
| Ecuador | Santo Domingo | 88.9 | 356.8 | 145.2% | 59.8% | 100.5% | 145.2% | 230.4% | 9.6% | 59.8% | -0.4°C | 90.9% | nan | 2 | nan | Out of season | 0.0 — Healthy |
| Ecuador | Buena Fe | 73.8 | 331.7 | 160.9% | 72.9% | 139.8% | 160.9% | 264.1% | 1.5% | 72.9% | -0.4°C | 89.8% | nan | 2 | nan | Out of season | 0.0 — Healthy |
| Ecuador | Babahoyo | 39.1 | 235.6 | 198.4% | 103.4% | 183.3% | 198.4% | 280.2% | 0.6% | 103.4% | -2.0°C | 87.7% | nan | 2 | nan | Out of season | 0.0 — Healthy |
| Ecuador | El Carmen | 88.9 | 356.8 | 145.2% | 59.8% | 100.5% | 145.2% | 230.4% | 9.6% | 59.8% | -0.4°C | 90.9% | nan | 2 | nan | Out of season | 0.0 — Healthy |
| Ecuador | Pichincha | 46.0 | 204.2 | 135.8% | 54.2% | 119.0% | 135.8% | 257.0% | -22.8% | 54.2% | 0.9°C | 83.3% | nan | 2 | nan | Out of season | 0.0 — Healthy |
| Ecuador | Naranjal | 29.0 | 172.6 | 158.7% | 42.9% | 125.0% | 158.7% | 214.4% | -37.9% | 42.9% | -1.8°C | 86.0% | nan | 2 | nan | Out of season | 0.0 — Healthy |
| Ecuador | Balao | 14.9 | 101.8 | 166.1% | 28.5% | 118.3% | 166.1% | 268.9% | -61.6% | 28.5% | -0.0°C | 83.1% | nan | 2 | nan | Out of season | 0.0 — Healthy |
| Ecuador | Lago Agrio | 78.5 | 290.7 | 11.0% | -15.6% | 13.7% | 11.0% | 19.7% | -14.6% | -15.6% | -0.5°C | 92.5% | nan | 2 | nan | Out of season | 0.0 — Healthy |
| Ghana | Sunyani | 24.0 | 157.4 | -26.8% | -41.8% | -29.4% | -26.8% | -24.8% | -43.9% | -41.8% | 0.9°C | 85.2% | nan | 2 | nan | Out of season | 32.0 — Healthy |
| Ghana | Goaso | 30.5 | 181.9 | -21.9% | -37.2% | -31.2% | -21.9% | -21.4% | -28.1% | -37.2% | 0.6°C | 88.1% | nan | 2 | nan | Out of season | 26.0 — Healthy |
| Ghana | Bibiani | 42.9 | 220.8 | -13.0% | -27.3% | -25.8% | -13.0% | -11.7% | -10.3% | -27.3% | 0.6°C | 89.1% | nan | 2 | nan | Out of season | 8.0 — Healthy |
| Ghana | Kumasi | 44.9 | 215.4 | -9.8% | -25.4% | -27.9% | -9.8% | -12.0% | 9.1% | -25.4% | 0.6°C | 88.8% | nan | 2 | nan | Out of season | 0.0 — Healthy |
| Ghana | Sefwi-Wiawso | 51.9 | 258.4 | -7.8% | -21.4% | -21.5% | -7.8% | -5.3% | -14.0% | -21.4% | 0.4°C | 90.3% | nan | 2 | nan | Out of season | 0.0 — Healthy |
| Ghana | Koforidua | 36.0 | 233.2 | 15.3% | -14.5% | 6.2% | 15.3% | 15.5% | -30.3% | -14.5% | 0.8°C | 85.1% | nan | 2 | nan | Out of season | 0.0 — Healthy |
| Ghana | Nkawkaw | 34.0 | 190.6 | 7.5% | -4.8% | -6.6% | 7.5% | 3.4% | -4.4% | -4.8% | 0.5°C | 86.5% | nan | 2 | nan | Out of season | 0.0 — Healthy |
| Ghana | Tarkwa | 55.6 | 272.9 | -3.5% | -13.2% | -20.2% | -3.5% | -3.3% | -1.4% | -13.2% | 0.2°C | 91.0% | nan | 2 | nan | Out of season | 0.0 — Healthy |
| Ghana | Enchi | 51.9 | 258.4 | -7.8% | -21.4% | -21.5% | -7.8% | -5.3% | -14.0% | -21.4% | 0.4°C | 90.3% | nan | 2 | nan | Out of season | 0.0 — Healthy |
| Ghana | Dunkwa | 53.1 | 252.8 | -4.8% | -18.6% | -23.9% | -4.8% | -5.0% | 8.0% | -18.6% | 0.3°C | 90.2% | nan | 2 | nan | Out of season | 0.0 — Healthy |
| Indonesia | Kendari | 12.2 | 131.8 | -39.9% | -51.0% | -42.5% | -39.9% | -56.8% | -50.1% | -51.0% | 0.7°C | 80.9% | nan | 3 | nan | Out of season | 36.0 — Mild stress |
| Indonesia | Bandar Lampung | 17.7 | 75.0 | -47.9% | -57.9% | -51.8% | -47.9% | -46.8% | -66.6% | -57.9% | 0.7°C | 82.4% | nan | 2 | nan | Out of season | 36.0 — Mild stress |
| Indonesia | Metro | 15.8 | 70.9 | -43.1% | -57.4% | -47.5% | -43.1% | -45.9% | -72.1% | -57.4% | 0.0°C | 87.8% | nan | 2 | nan | Out of season | 36.0 — Mild stress |
| Indonesia | Mamuju | 23.0 | 169.9 | -27.2% | -15.0% | -31.4% | -27.2% | -46.9% | -19.0% | -15.0% | 0.5°C | 74.3% | nan | 2 | nan | Out of season | 28.0 — Healthy |
| Indonesia | Makassar | 9.8 | 70.8 | -38.5% | -13.0% | -15.7% | -38.5% | -29.4% | -21.7% | -13.0% | -0.3°C | 77.1% | nan | 2 | nan | Out of season | 28.0 — Healthy |
| Indonesia | Kolaka | 19.5 | 122.0 | -41.2% | -53.8% | -46.2% | -41.2% | -57.4% | -12.0% | -53.8% | 0.3°C | 89.0% | nan | 2 | nan | Out of season | 26.0 — Healthy |
| Indonesia | Luwu | 23.0 | 168.1 | -23.8% | 6.3% | -22.4% | -23.8% | -41.7% | -29.3% | 6.3% | 0.7°C | 89.4% | nan | 2 | nan | Out of season | 26.0 — Healthy |
| Indonesia | Polewali | 27.1 | 116.7 | -31.1% | -10.4% | -22.7% | -31.1% | -46.0% | 41.3% | -10.4% | -0.3°C | 83.6% | nan | 2 | nan | Out of season | 16.0 — Healthy |
| Indonesia | Palu | 71.6 | 315.5 | 43.7% | 78.2% | 26.4% | 43.7% | 19.1% | 39.2% | 78.2% | 0.8°C | 86.4% | nan | 2 | nan | Out of season | 0.0 — Healthy |
| Indonesia | Donggala | 34.2 | 172.5 | -4.0% | 4.9% | -18.9% | -4.0% | -15.9% | -49.8% | 4.9% | -0.2°C | 77.4% | nan | 2 | nan | Out of season | 0.0 — Healthy |
| Indonesia | Poso | 41.8 | 284.8 | 15.1% | 29.1% | 3.5% | 15.1% | 6.2% | -41.8% | 29.1% | 0.0°C | 86.9% | nan | 2 | nan | Out of season | 0.0 — Healthy |
| Indonesia | Bone | 17.2 | 141.2 | 24.6% | 3.6% | 29.7% | 24.6% | 1.0% | -52.7% | 3.6% | -0.2°C | 77.2% | nan | 2 | nan | Out of season | 0.0 — Healthy |
| Nigeria | Akure | 12.1 | 184.8 | -31.0% | -18.9% | -28.7% | -31.0% | -24.2% | -51.4% | -18.9% | 1.1°C | 85.2% | nan | 2 | nan | Out of season | 32.0 — Healthy |
| Nigeria | Osogbo | 15.4 | 216.9 | -23.6% | -6.2% | -17.1% | -23.6% | -17.3% | -31.3% | -6.2% | 1.4°C | 81.4% | nan | 2 | nan | Out of season | 32.0 — Healthy |
| Nigeria | Ado-Ekiti | 12.1 | 184.8 | -31.0% | -18.9% | -28.7% | -31.0% | -24.2% | -51.4% | -18.9% | 1.1°C | 85.2% | nan | 2 | nan | Out of season | 32.0 — Healthy |
| Nigeria | Abeokuta | 26.2 | 184.1 | -21.6% | -20.3% | -25.7% | -21.6% | -14.5% | -42.4% | -20.3% | 0.9°C | 86.2% | nan | 2 | nan | Out of season | 32.0 — Healthy |
| Nigeria | Ondo | 20.0 | 197.5 | -27.5% | -18.9% | -25.1% | -27.5% | -20.3% | -41.1% | -18.9% | 0.8°C | 88.9% | nan | 2 | nan | Out of season | 26.0 — Healthy |
| Nigeria | Ile-Oluji | 20.0 | 197.5 | -27.5% | -18.9% | -25.1% | -27.5% | -20.3% | -41.1% | -18.9% | 0.8°C | 88.9% | nan | 2 | nan | Out of season | 26.0 — Healthy |
| Nigeria | Calabar | 53.0 | 286.3 | -22.2% | 38.9% | -37.2% | -22.2% | -17.0% | 40.0% | 38.9% | -0.3°C | 90.3% | nan | 2 | nan | Out of season | 26.0 — Healthy |
| Nigeria | Ikom | 40.6 | 379.6 | 61.0% | 99.6% | 35.1% | 61.0% | 58.1% | 66.5% | 99.6% | -0.4°C | 90.0% | nan | 2 | nan | Out of season | 0.0 — Healthy |
Weather Charts